|
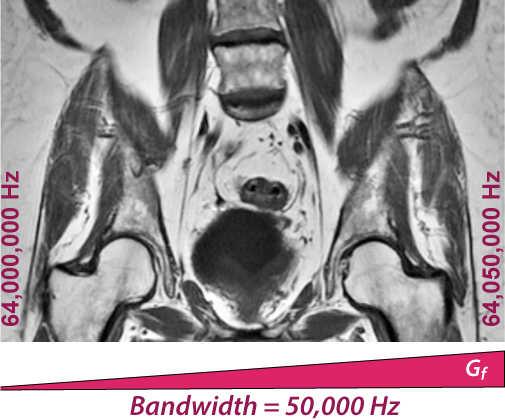
Recall that one dimension of an image is typically frequency-encoded by applying a spatially-varying gradient (Gf) in that direction. This gradient slightly alters the precession frequencies as shown in the adjacent image. In this example the voxels at the extreme left side of the image resonate at 64,000,000 Hz while those at the far right resonate at 64,050,000 Hz. The total rBW is therefore 50,000 Hz. This value is an operator-selectable parameter, chosen by the technologist before the scan begins. Available values for total receiver BW range from about 5-100 kHz with 50kHz being typical.
This total bandwidth is apportioned to pixels along the frequency-encoding direction equally. The width (Δw) of each pixel, in turn, is determined by two additional operator-selected parameters: the field-of-view in the frequency-encoding direction (FOVf) and the number of frequency-encoding steps (Nf). |
BW per pixel = Total BW ÷ Nf
|
Philips has a somewhat obtuse way of prescribing bandwidth - the "fat/water shift" in pixels. At 1.5T the resonant frequencies of fat and water protons differ by about 220 Hz causing them to refocus in slightly different positions in the image. This is known as the chemical shift artifact and will be explained much more completely in a future Q&A. Continuing the example above, a BW of 195 Hz/pixel at 1.5T would be reported by Philips as 220/195 = 1.1 pixels (Px). At 3.0T the chemical shift difference is about 440 Hz, so the Philips BW at this field would be reported as 2.2 pixels.
|
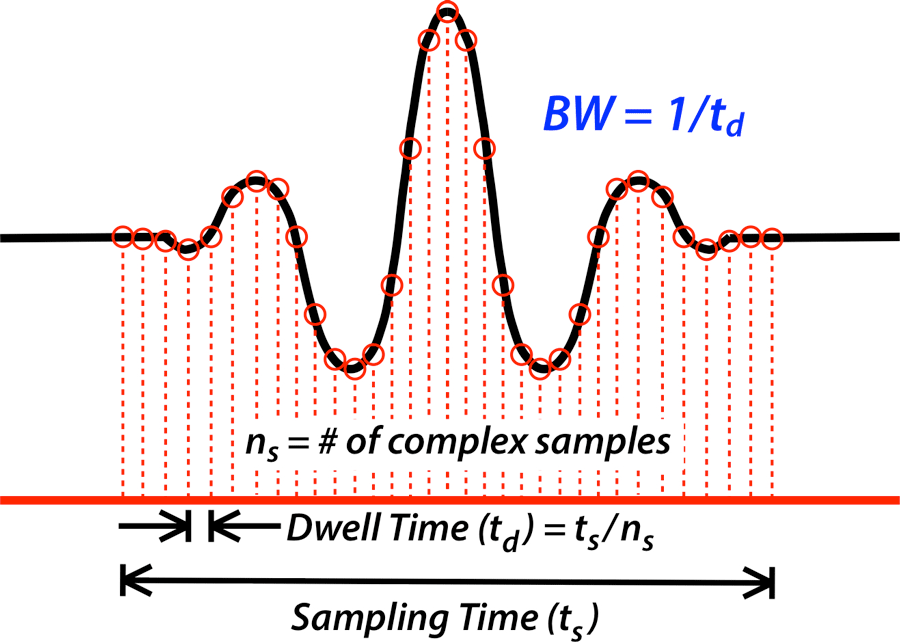
At the "nuts and bolts" level, receiver BW is the same as the digitization rate of the MR signal. The dwell time (td) is the interval between digitized samples. This, in turn, is defined by the sampling time (ts) and the number of complex samples (ns) measured.
Continuing the above example, if 256 samples were acquired in 5.12 ms, the dwell time (td) would be 5.12 ms/256 = 20 μs. This would result in a total receiver BW of 1/20μs = 50,000 Hz. |
Advanced Discussion (show/hide)»
You might wonder why our definition of BW=1/td isn't in conflict with the Nyquist criterion from sampling theory. The Nyquist criterion requires that a sinusoid must be sampled at least twice per cycle to determine its true frequency. So it would seem the proper equation should be BW=1/2td.
The answer is that in MRI we sample in complex mode, collecting both real and imaginary data for each point. If we only sampled a single real signal (as is done in some older NMR spectrometers and very old MRI scanners), then the true BW would be only 1/2td. We would be able to detect signals over the the range −1/2td to +1/2td, but would be unable to distinguish positive from negative frequencies within this range. The bandwidth we can actually represent is only from 0 to 1/2td.
Collecting both the real and imaginary data allows us to distinguish +1/2td from −1/2td. The full usable bandwidth is therefore BW = +1/2td − (−1/2td) = 1/td. The maximum detectable frequency is still 1/2td, but we can now distinguish positive from negative frequencies in that range.
Another topic ignored in the above discussion is the concept of frequency oversampling. For simplicity, I didn't make a sharp distinction between Nf, the displayed number of pixels in the frequency-encode direction, and ns, the number of complex data points in the signal actually sampled. The high digitization rates available on modern scanners now allows the MR signal to be sampled at rates much higher than that required for the desired display resolution. In general, ns may exceed Nf by a factor of two or more. Thus it is possible (and commonplace) to sample 512 or 1024 points of the MR signal even though the base display resolution in the frequency-encoding direction may still be only Nf = 256. This is known as frequency oversampling and is useful for eliminating aliasing (wrap-around) artifacts in the frequency-encode direction. Routine frequency oversampling is why we typically see this artifact only in the phase-encode and not in the frequency-encode direction. Much more on this in a later Q&A!
Graessner J. Bandwidth in MRI? MAGNETOM Flash 2/2013, pp 3-8. (very nice educational article available online at www.siemens.com/magnetom-world).
How does frequency-encoding work?
What is narrow bandwidth, and when would you want to use it?


